TOTAL U.S. DEATHS [ALL CAUSES]:
2017 Total Deaths US: 2,813,503 (234,000/month)
https://www.cdc.gov/nchs/products/databriefs/db328.htm
2018 Total Deaths US: 2,839,205 (237,000/month)
https://www.cdc.gov/nchs/products/databriefs/db355.htm2019
Total Deaths US: 2,855,000 (238,000/month)
https://www.cdc.gov/nchs/nvss/vsrr/provisional-tables.htm
2020 Total Deaths US (jan - week 9/26): 2,130,000 (236,000/month)
https://data.cdc.gov/NCHS/Weekly-Counts-of-Deaths-by-State-and-Select-Causes/muzy-jte6
2,130,000 + (236,000/month x 3) [Oct, Nov, Dec] = 2,838,000 [assumption
based on monthly avg]
2020: 2,838,000 [3-month assumption insert]
2019: 2,855,000
2018: 2,839,000
2017: 2,814,000
Why did select [D] govs push C19 infected patients into nursing homes?
% of total C19 deaths attributed to nursing home(s)?
Who is most susceptible?
Same [D] govs who pushed C19 infected patients into nursing homes
attempting to keep State(s) closed?
Why?
In 2017, a total of 2,813,503 resident deaths were registered in the United States—69,255 more deaths than in 2016. From 2016 to 2017, the age-adjusted death rate for the total population increased 0.4%, and life expectancy at birth decreased 0.1 year. Age-specific death rates between 2016 and 2017 increased for age groups 25–34, 35–44, and 85 and over, and decreased for age group 45–54. Age-adjusted death rates increased for non-Hispanic white males and non-Hispanic white females and decreased for non-Hispanic black females.
In 2018, a total of 2,839,205 resident deaths were registered in the United States—25,702 more deaths than in 2017. From 2017 to 2018, the age-adjusted death rate for the total population decreased 1.1%, and life expectancy at birth increased 0.1 year. Age-specific death rates between 2017 and 2018 decreased for age groups 15–24, 25–34, 45–54, 65–74, 75–84, and 85 and over.
|
deaths jan-jun 20200 |
1,574,115 |
|
|
jan-jun 2019 |
1,443,000 |
|
|
increase |
131,115 |
|
2019
|
Year |
Month |
Number of Live Births |
Number of Deaths |
Number of Infant Deaths |
12 Month-ending Number of Live Births |
12 Month-ending Number of Deaths |
12 Month-ending Number of Infant Deaths |
|
2019 |
January |
311,000 |
258,000 |
1,700 |
3,786,000 |
2,806,000 |
20,900 |
|
2019 |
February |
280,000 |
233,000 |
1,600 |
3,782,000 |
2,801,000 |
20,900 |
|
2019 |
March |
304,000 |
255,000 |
1,800 |
3,770,000 |
2,807,000 |
20,900 |
|
2019 |
April |
299,000 |
235,000 |
1,700 |
3,771,000 |
2,810,000 |
20,900 |
|
2019 |
May |
316,000 |
237,000 |
1,800 |
3,767,000 |
2,817,000 |
20,900 |
|
2019 |
June |
304,000 |
225,000 |
1,800 |
3,756,000 |
2,823,000 |
21,000 |
|
2019 |
July |
334,000 |
229,000 |
1,800 |
3,760,000 |
2,827,000 |
21,000 |
|
2019 |
August |
342,000 |
227,000 |
1,800 |
3,757,000 |
2,831,000 |
21,000 |
|
2019 |
September |
326,000 |
223,000 |
1,700 |
3,760,000 |
2,834,000 |
20,900 |
|
2019 |
October |
325,000 |
238,000 |
1,700 |
3,758,000 |
2,839,000 |
20,800 |
|
2019 |
November |
298,000 |
239,000 |
1,700 |
3,749,000 |
2,846,000 |
20,800 |
|
2019 |
December |
309,000 |
256,000 |
1,800 |
3,748,000 |
2,855,000 |
20,900 |
|
2020 |
January |
304,000 |
263,000 |
1,700 |
3,742,000 |
2,861,000 |
21,000 |
|
2020 |
February |
282,000 |
243,000 |
1,600 |
3,744,000 |
2,871,000 |
21,000 |
|
2020 |
March |
301,000 |
268,000 |
1,600 |
3,741,000 |
2,884,000 |
20,700 |
Showing 1 to 15 of 15 entries
Preliminary Cumulative Estimates of Hospitalizations in the U.S. 2019-2020 Flu Season
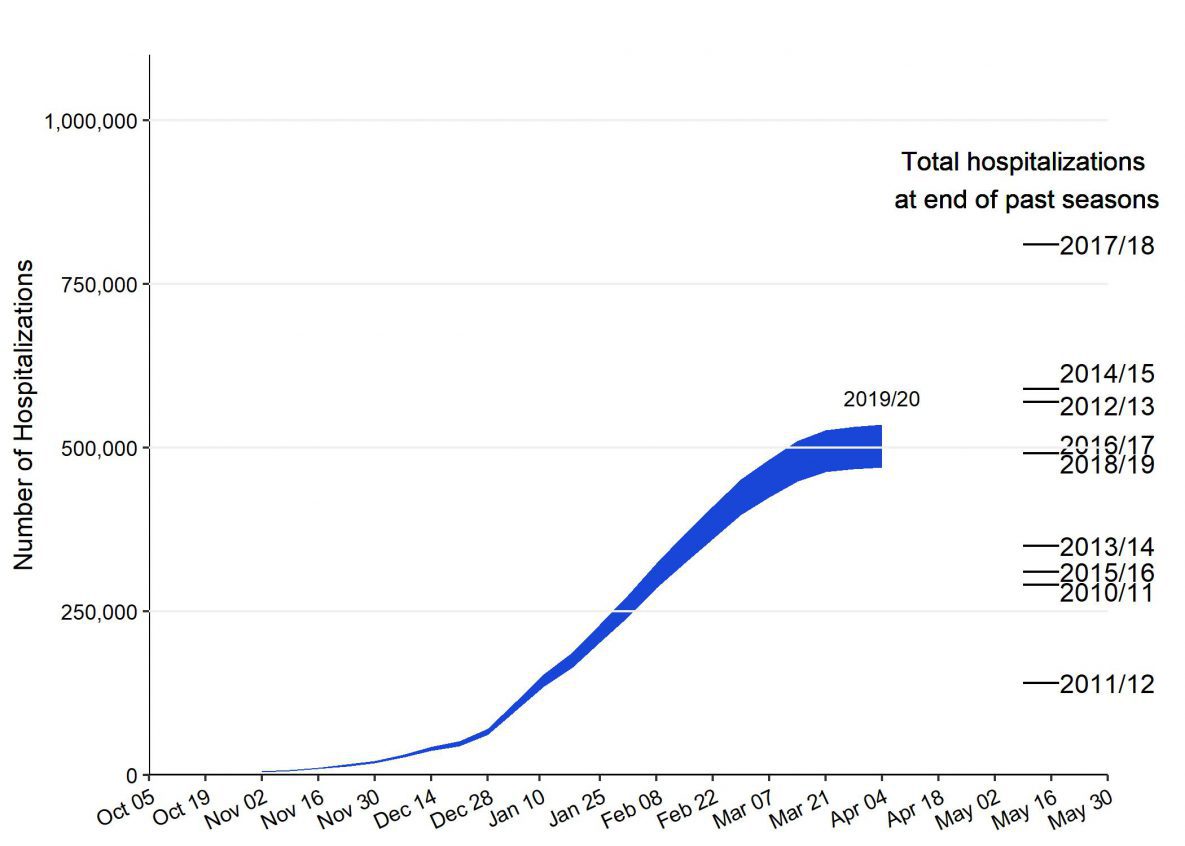
*These estimates are preliminary and based on data from CDC’s weekly influenza surveillance reports summarizing key influenza activity indicators.
https://www.cdc.gov/nchs/nvss/deaths.htm?CDC_AA_refVal=https%3A%2F%2Fwww.cdc.gov%2Fnchs%2Fdeaths.htm
https://www.cdc.gov/nchs/nvss/vsrr/covid19/excess_deaths.htm
https://www.cdc.gov/nchs/nvss/vsrr/covid19/excess_deaths.htm
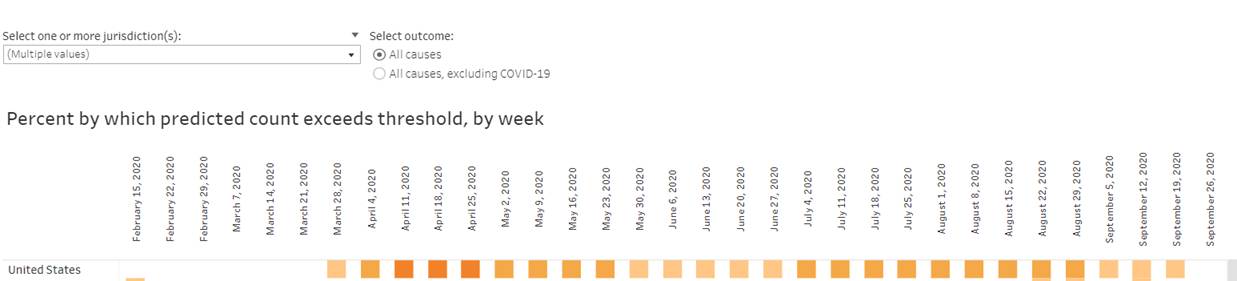

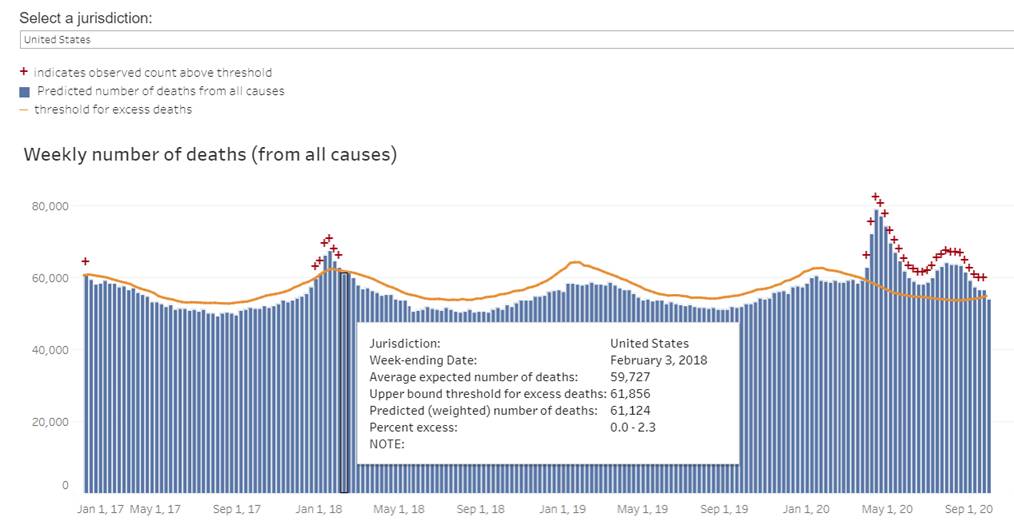
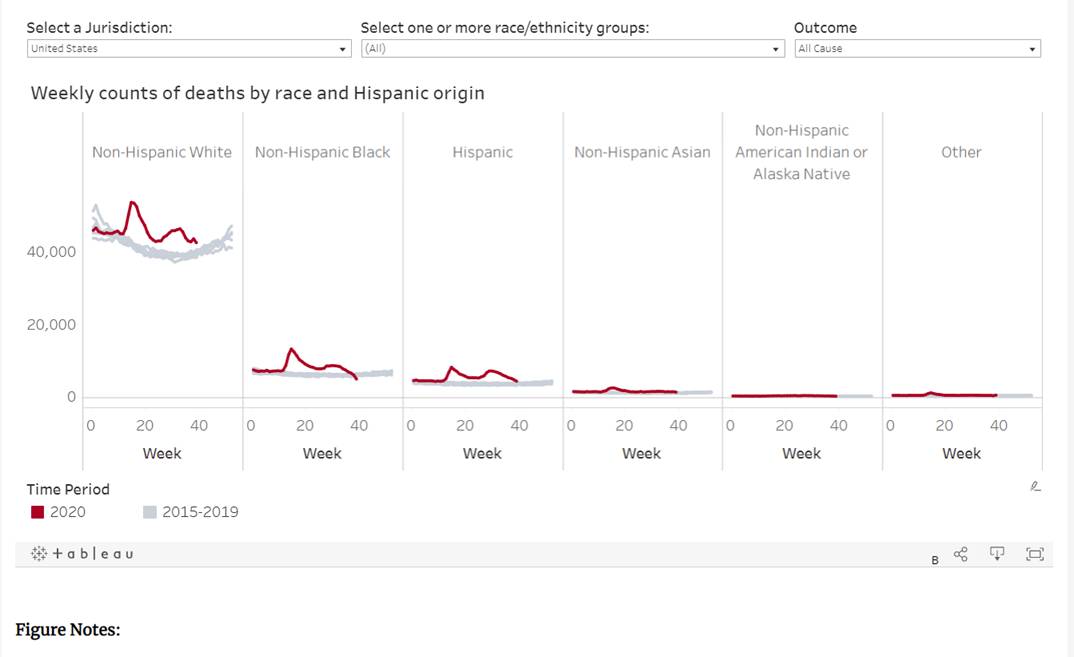
Figure Notes:
Number of deaths reported on this page are the total number of deaths received and coded as of the date of analysis
|
WEEK |
EXCESS |
|
April 1,2020 |
5578 |
|
15372 |
|
|
22716 |
|
|
APRIL 18,2020 |
21439 |
|
19142 |
|
|
MAY 2,2020 |
15173 |
|
13153 |
|
|
11191 |
|
|
MAY 23,2020 |
8603 |
|
6872 |
|
|
JUNE6,2020 |
6232 |
|
5567 |
|
|
5567 |
|
|
6257 |
|
|
JULY 4,2020 |
7725 |
|
9885 |
|
|
11207 |
|
|
12190 |
|
|
AUG 1,2020 |
11983 |
|
12091 |
|
|
AUG 15. 2020 |
11881 |
|
9887 |
|
|
7518 |
|
|
SEPT 5,2020 |
5518 |
|
4544 |
|
|
4190 |
|
|
SEPT 26,2020 |
1201 |
|
TOTAL |
272,682 |